
Ultrasound 101 – Part 11: Describing an Ultrasound Image

Welcome to Ultrasound 101. In this 12-part series, we will talk about the basic principles of medical ultrasound, the equipment you will use, the settings on your machine, and of course, how to use sonography in your patients. Each part will focus on a specific topic and allow you to experiment with the scanner, adjust the settings on your machine, and get the best out of your ultrasound examination.
Throughout this series, you have learned a lot about how to use ultrasound, how to set your machine, how to move your hand, which settings are essential, and a little bit about the technology behind it all. Today, I want to focus on vocabulary and how to comprehensively describe your findings or how to understand a description given by someone else. This is not only important for writing a good report but also for getting a mental image of something a colleague or textbook might describe. So let’s get into the terminology!
Near- and far field
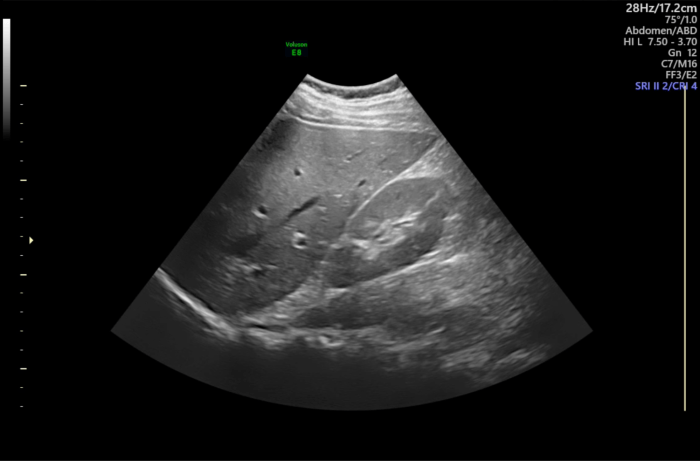
Look at this image of the liver and right kidney; we will use it in this part to learn how to describe an ultrasound image.
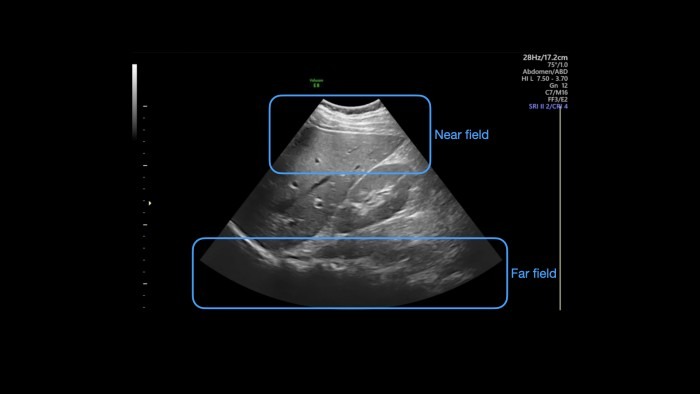
The first rough division can be done into the near and far fields. The near field is close to the transducer. Depending on your device settings, this is usually at the top of the screen and close to the skin - I would consider the top third of the image as the near field area. Furthest away from the transducer lies the far field, which usually means the bottom third of the picture. Between the near field and the far field lies the midfield.
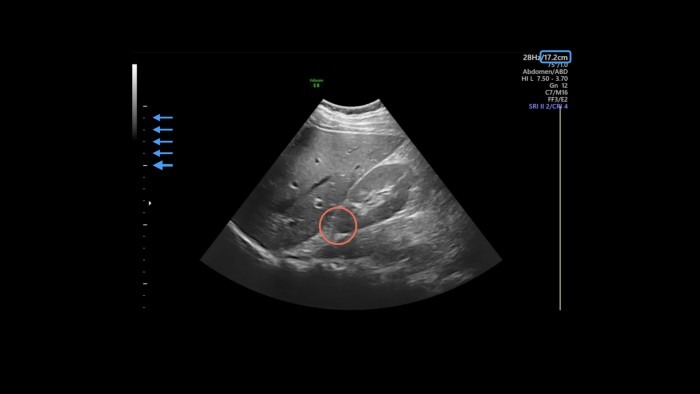
Another way to refer to an object in the image is by using depth. As you already know from part 4, you can adjust the imaging depth to your current needs, and the scale at the edge of the screen tells you where things are. You can find the maximum depth either at the bottom of the scale or, as in this case, at the top right corner with the other imaging metrics (blue box in the next image). The scale usually has markings in one-centimeter increments, with every fifth marking a little bigger, like a ruler (blue arrows). For example, say you want to pinpoint the cranial pole of the kidney (red circle): it lies at 10 cm depth.
Light and dark spots
As we all know, an ultrasound image is made up of lighter and darker areas and several shades of gray. Being the skilled sonographer you are, you already know that this feature of a structure being lighter or darker on the screen is called echogenicity. When describing the image, we usually use the relative echogenicity of certain areas to characterize them. For example, if you want to specify the renal pelvis (blue arrows), you would write that there is a hyperechoic area in the mid-field surrounded by hypoechoic renal parenchyma.
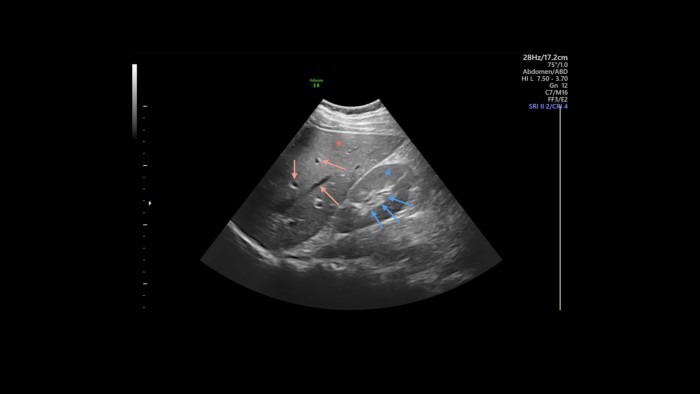
In a healthy liver and kidney, the two organs’ parenchymas have roughly the same texture and echogenicity, which we call isoechoic. So in our image, you could report that the renal parenchyma (blue star) and the liver parenchyma (red star) are isoechoic.
Throughout the image, you can see dark spots and streaks, i.e., areas that don’t show any echos (red arrows). We call these areas anechoic, which are usually collections of fluid (within vessels, ascites, effusion, urine, etc.) or regions behind solid structures, which we call acoustic shadowing (see part 8 for repetition on this). I marked some anechoic spots in the liver with red arrows; these are blood vessels or bile ducts running through the organ. (If you want to know which one it is, you can use color Doppler to display blood flow.)
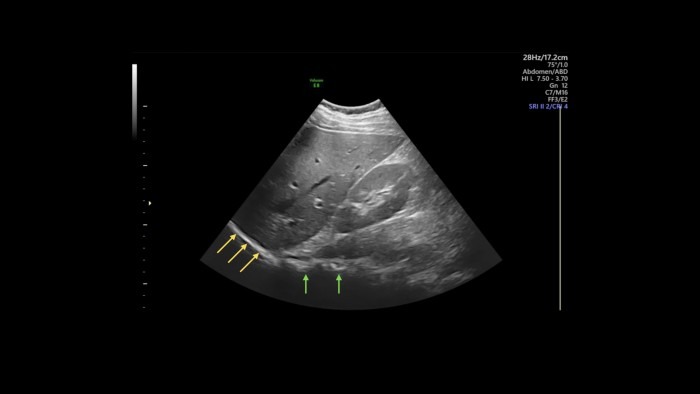
In the left side far field of the image, you can see a smooth, hyperechoic line at the edge of the liver (yellow arrows in the picture below), this is the diaphragm with lung on the other side (which is anechoic - black - in this image because a) the diaphragm is very reflective and b) the lung is air-filled and thus doesn’t have any echoes). In the center of the far field, you see another hyperechoic structure with acoustic shadowing behind it (green arrows), this time with an irregular border. This is the spine, whose boney surface is highly reflective and thus shadows the area behind it. You can revisit parts 7 and 8 if you want to freshen up on the background of echogenicity, shadowing, and reflection.
Now you might ask yourself, why would you ever describe an image like this in such detail? Will I really need to tell anyone at what depth the kidney lies and that the renal pelvis is surrounded by its parenchyma? The answer is: probably not. But think of pathologies, like cysts, for example: you can use the vocabulary you just learned to describe precisely where the cyst lies, if its composition is hypo-, iso-, or hyperechoic, and what its border looks like. You can also relate the cyst’s appearance to the surrounding tissue. There are many other pathologies you can describe with the same vocabulary. Speaking of cysts - size matters, which brings us to the next part.
Measurements
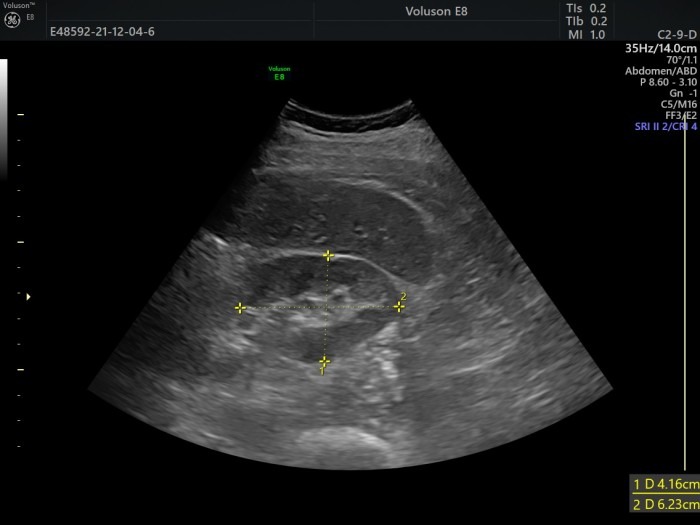
In part 9, we talked about documentation and quantification, and of course, you should include measurements in your report. Here is a transverse view of a kidney using the caliper instrument. You should report relevant measurements directly in your statement (“diameter medial to lateral: 4.16cm,…”), but I also recommend attaching a picture like this to your report. The reason is that you (or anyone else looking at it) can see exactly what was measured, i.e., where exactly the caliper was put. This allows for more accurate follow-up measurements since you always use the same method with the same patient.
Spatial orientation
Remember part 2, where we talked about image orientation and where your marker points to? Knowing your bearings in ultrasound is extremely important not only for imaging but also for reporting your findings. Depending on your field of work, you might want to describe the image itself using directions such as near-field or far-field, or you might want to use anatomical orientations like lateral, caudal, etc. The latter allows a surgeon, for example, to use your report to find a tumor during surgery. Since you are the only one knowing how you held and oriented your transducer during the examination, it is crucial to describe structures objectively. You can always revisit part 2 if you want to refresh your knowledge about transducer orientations.
Summary
Today’s part focused on describing an ultrasound image and the particular vocabulary like hypoechoic, near-field, or smooth and rough surfaces used in this line of work. You can now better understand a textbook describing a certain view, and you will be able to explain your findings to colleagues and students. In the next and last part of Ultrasound 101, we put a few things together in a short video and recap the imaging skills we discussed throughout this series. So I hope to see you all again in the next part and until then, enjoy imaging!