
4.4 How to assess diastolic function


Several techniques and parameters have been introduced to assess diastolic function of the heart. The complexity of this phenomenon and the difficulties in interpreting these findings have led to confusion among those performing echocardiography as well as those who interpret its results. To cover the entire spectrum of possibilities, the most commonly used modalities are described in this chapter. A simple and practical approach to “diastology” is also provided in order to assist you in viewing this information in the appropriate context. Finally, at the end of the chapter you will find a few examples of diastolic function in the clinical setting.
If you want to get an overview, read Diastolic Function & Diastolic Dysfunction first.
4.4.1 Mitral Inflow signal to assess diastolic dysfunction
The evaluation mitral inflow plays an important role in grading diastolic dysfunction in patients with reduced EF or structural heart disease.
The mitral inflow signal visualizes the individual phases of filling as well as displays the contribution of each individual phase in filling. As mitral inflow reflects the pressure difference between the atria and the ventricle, any abnormality of diastolic pressure (as in the presence of diastolic dysfunction) in the chambers will affect the velocity and shape of the Doppler inflow signal. Specifically, diastolic dysfunction alters the relationship between early and late filling (E- and A-wave), how rapidly flow velocity declines in early diastole (E-wave deceleration time = DT), and how long it takes for filling of the ventricle to start after the ventricle relaxes (length of the isovolumetric relaxation time = IVRT).
4.4.1.1 Normal diastolic function
Under normal conditions most of the blood will fill the ventricle during early diastole (passive filling). Thus, the E-wave is taller than the A-wave. Mitral E/A ratio - cut off value: ≤ 0.8 & > 2. The shape of the E-wave is quite symmetrical and the normal deceleration time (DT) - cut off value: 140 - 240 msec. Filling does not start immediately after the end of systole. First the pressure in the ventricle has to drop below that of the left atrium. The time until this happens is referred to as the isovolumetric relaxation time (IVRT). Under normal conditions: Isovolumetric relaxation time (IVRT) - cut off value: ≤ 70 mm/sec - >100 mm/sec.
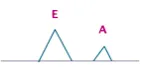
Normal pattern of diastolic filling: the E-wave is taller than the A-wave
4.4.1.2 Supernormal filling
Especially young and physically active individuals will demonstrate a vigorous recoil of the ventricle during diastole. This creates negative pressure in the ventricle and causes suction of blood from the atrium during early filling. The most prominent finding on the Doppler inflow signal is a very high E-wave. As most of the blood in the left atrium is emptied during this phase, not much volume will remain in the atrium to be “pushed” into the ventricle during atrial contraction. Thus the A-wave will be rather small. In this setting you will find an E/A ratio >2. The IVRT is short and the deceleration time normal. The spectrum of supernormal diastolic function may look very similar to a restrictive filling pattern (see below). You will later see how these two conditions can be distinguished from each other.
Supernormal filling: the E-wave is at least twice as high as the A-wave.
4.4.1.3 Impaired relaxation - grade 1 diastolic dysfunction
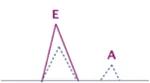
A stiff ventricle will impair early filling of the ventricle. Thus, the magnitude of the E-wave will decrease. It will take longer for atrial pressure to be high enough to initiate filling. The IVRT will increase (> 100 ms) and the DT will also be prolonged (≥ 240 ms). As less volume is transported into the left ventricle during early filling, more blood is present at the time of atrial contraction. Therefore atrial contraction will eject more blood into the left ventricle. The A-wave will be larger than normal and will typically also be larger than the E-wave (E/A ratio ≤ 0.8). Thus atrial contraction basically compensates for the decrease in early filling. This also explains why patients who develop atrial fibrillation (no atrial contraction) in the presence of a stiff ventricle (i.e. left ventricular hypertrophy) become highly symptomatic. Impaired relaxation is termed “grade I diastolic dysfunction”. Under these circumstances, filling pressure is still normal or just mildly elevated. It is a common condition and may also be observed in elderly patients. In fact, it may be considered as a normal aspect of the aging process.
Disturbed relaxation: the A-wave is taller than the E-wave
Impaired relaxation is a common occurrence. 25% of the adult population over 40 years of age have grade I diastolic dysfunction.
4.4.1.4 Pseudonormal filling pattern - grade 2 diastolic dysfunction
Progressive diastolic dysfunction causes left atrial pressure to rise. The latter increases the pressure gradient between the left atrium and the left ventricle and will act as a driving force to fill the ventricle during early diastole. Thus the size of the E-wave relative to the A-wave will increase, and the E/A ratio will return to the range of 0.8 to 1.5. DT and IVRT (< 90 ms) will also decrease. The spectrum will look very similar to that of “normal” diastolic function. This condition is therefore referred to as “pseudonormal”. Pseudonormal filling is classified as grade II diastolic dysfunction. Several approaches may be used to distinguish between “normal” and pseudonormal filling:
Pseudonormal filling: the E-wave is taller than the A-wave; the deceleration time is short.
- Is diastolic dysfunction likely?
When the echocardiogram is otherwise normal (normal systolic function, no left ventricular hypertrophy, normal size of the left ventricle, etc.) and the patient is young, the filling pattern is most likely indicative of normal diastolic function.
- Valsalva maneuver:
The Valsalva maneuver increases intrathoracic pressure and thus reduces venous return to the atrium. This “unloads” the ventricle and causes a drop in filling pressure. Thus, the Valsalva maneuver permits the investigator to unmask elevated filling pressures. In the presence of pseudonormal filling one will see a “reversal” of the pattern to that of impaired relaxation (the E/A ratio will drop below 1). Valsalva maneuver unmasks diastolic dysfunction and alters pseudnormal filling into impaired relaxation. To perform a Valsalva maneuver let the patient press while he is in mid-breathing level. Observe the mitral inflow signal. The maneuver is effective once you see a rise in heart rate. Usually you will also see a decrease in overall inflow velocity.
- Other modalities:
The use of tissue Doppler at the mitral annulus (see below) permits the investigator to estimate filling pressure. An average E/e´ ratio above 14 is indicative of diastolic dysfunction (ratios between 8 and 12 denote possible diastolic dysfunction). The pattern will be that of pseudonormal filling. Aside from TDI one may also view the pulmonary inflow pattern and flow propagation. These methods will be discussed in the following sections.
4.4.1.5 Reversible restrictive filling pattern - grade 3 diastolic dysfunction
A further increase in filling pressure will increase the gradient between the left atrium and the left ventricle during early diastole. The E-wave will become even taller and the A-wave shorter. The E/A ratio will be ≥ 2. In severe forms the A-wave may be so small as to be nearly invisible, and the E/A ratio may reach very high values of 5 or more.
When filling pressures are high, flow into the ventricle will start early and filling will terminate quickly. Therefore, typical additional signs of restrictive filling include a short IVRT (≤ 70 ms) and DT (<140 ms). In some patients it will be possible to reduce left atrial pressure by performing a Valsalva maneuver. When a Valsalva maneuver is able to reverse restrictive filling to a “pseudonormal” pattern we quantify diastolic dysfunction as “grade III”. In other words, unloading of the ventricle is still able to cause a significant drop in filling pressure.
As mentioned previously, the restrictive filling pattern appears quite similar to that of supernormal filling. However, in clinical practice it is rarely difficult to distinguish between the two phenomena. Patients with a restrictive pattern have a significantly elevated filling pattern, are thus “sick”, and highly symptomatic. Here one is confronted with individuals at one end of the spectrum. The echocardiogram always shows pronounced abnormalities (reduced left ventricular function, left ventricular hypertrophy, enlarged left atrium, etc.) as opposed to supernormal filling.
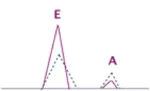
Restrictive filling pattern: the E-wave is more than twice the size of the A-wave
4.4.1.6 Irreversible restrictive filling Pattern - grade 4 diastolic dysfunction
This most severe form of diastolic dysfunction (grade 4) differs from grade 3 only by the fact that a Valsalva maneuver is unable to reverse the pattern to a pseudonormal one (see above). These patients commonly have advanced forms of heart failure and are usually symptomatic. In general, the larger the E/A ratio is and the shorter the deceleration time is, the higher are left atrial filling pressures and the less likely it will be for the pattern to be “reversed” to a pseudonormal one.
| 16- 20 years | 21- 40 years | 41- 60 years | > 60 years | |
|---|---|---|---|---|
| IVRT (ms) | 50 ± 9 | 67 ± 8 | 74 ± 7 | 87 ± 7 |
| DT (ms) | 142 ± 19 | 166 ± 14 | 181 ± 19 | 200 ± 29 |
| A duration | 113 ± 17 | 127 ± 13 | 133 ± 13 | 138 ± 19 |
| E/A | 1.88 ± 0.45 | 1.53 ± 0.4 | 1.28 ± 0.25 | 0.96 ± 0,18 |
In summary, the different filling patterns reflect the degree of diastolic dysfunction and the magnitude of filling pressures. Although the various forms do overlap in respect of the true filling pressure, several studies have shown that this grading scale correlates well with the severity of disease, NT-ProBNP levels, symptoms, and prognosis.
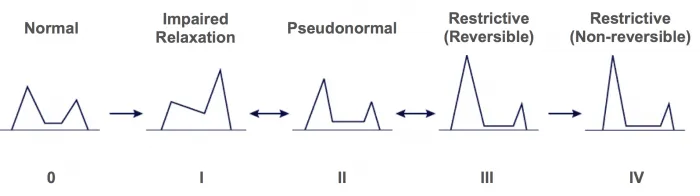
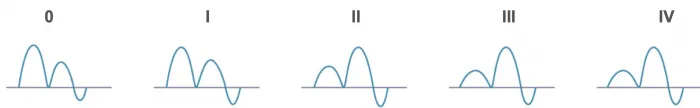
Grading of diastolic dysfunction based on the mitral inflow signal
4.4.1.6 Mitral inflow signal - Problems
The major drawback of using the Doppler inflow signal is that it is limited to patients who have sinus rhythm. Although the deceleration time itself also reflects diastolic dysfunction and a short deceleration time denotes elevated filling pressure, it does not permit grading of diastolic dysfunction.
The deceleration time may also be used to estimate filling pressures in a patient with atrial fibrillation; the E/A ratio cannot be used in these patients. A short deceleration time ( <130 ms) indicates elevated filling pressures.
It may be difficult to interpret the spectrum in clinical practice because one may be confronted with fusion of the E- and the A-wave. In these cases it is advisable to use provocation maneuvers that slow the heart rate (carotid massage).
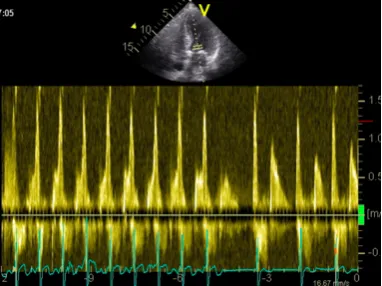
Complete fusion of the E- and the A-wave in a patient with tachycardia followed by carotid sinus massage, leading to separation of the E- and the A-wave
The E/A ratio may also fluctuate with respiration, such as between impaired relaxation and pseudonormal filling, and most likely is an intermediate stage between two patterns. In these cases it would be advisable to additionally use other modalities to grade diastolic dysfunction.
The magnitude of the E-wave also reflects transmitral flow volume. The E/A ratio may be misleading especially in the setting of (severe) mitral regurgitation.
4.4.1.7 The L-wave
Very little or almost no filling occurs during diastasis. However, when diastasis is rather long (bradycardia) and a clear separation is seen between the E-wave and the A-wave, an additional L-wave may be observed during mid-diastole. This wave indicates continued pulmonary vein flow through the left atrium (LA) into the left ventricle (LV) after early rapid filling.
Predisposing factors are reduced left ventricular relaxation in conjunction with increased left ventricular stiffness and elevated left atrial to left ventricular gradients. Thus, a prominent L-wave also denotes diastolic dysfunction. Several investigations have shown that its presence is correlated with symptoms, prognosis, and elevated filling pressures.
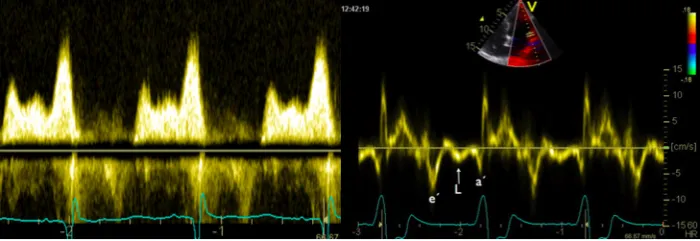
L-wave seen between the E- and the A-wave (mitral inflow signal) and e´and a´ (tissue Doppler signal)
The presence of an L-wave may help to differentiate a normal filling pattern from a pseudonormal one. When an L-wave is present you can be certain that the pattern is pseudonormal.
L-waves are also seen in the M-mode and with tissue Doppler
4.4.2 Tissue Doppler for the assessment of diastolic dysfunction
4.4.2.1 Introduction
The motion of the mitral valve annulus mirrors systolic as well as diastolic events. During systole the annulus moves caudally towards the apex, and during diastole it moves cranially towards the atrium. The motion of the annulus can be recorded with the help of PW tissue Doppler (TDI) at the medial (septal) as well as the lateral ring (in a four chamber view).
To measure the velocity of mitral annular motion use tissue Doppler (TDI) and place the sample volume approximately 1 cm within the insertion of the mitral valve leaflets.
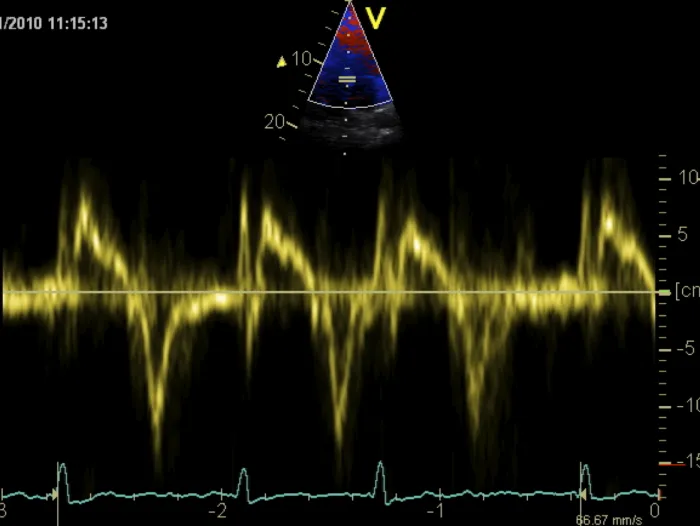
Tissue Doppler signal recorded from the medial annulus
On the Doppler tracing the diastolic signal shows a negative deflection. Similar to conventional Doppler of mitral inflow, you will find an E-wave and an A-wave. By definition these waves are termed e´ (e prime) and a´ (a prime). They also represent early and late diastolic filling, respectively. Tissue Doppler of the mitral annulus permits measurement of both time intervals (i.e. IVRT, deceleration time, QRS onset to mitral e´) and maximum velocities (e´ max, a´ max). However, while absolute values with tissue Doppler provide information about diastolic function, the relationship between these values and conventional PW Doppler is used more widely in clinical practice.
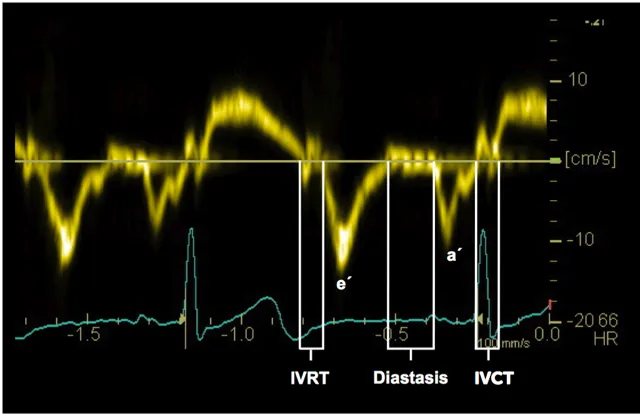
Timing of events based on the tissue Doppler signal at the mitral valve annulus
4.4.2.2 E/e´ ratio
To derive the E/e´ ratio one must divide the maximum velocity of the E-wave of mitral valve inflow by the maximal velocity of E. In normal individuals the E/e´ ratio is <8. In the presence of diastolic dysfunction / impaired relaxation, e´ will be rather low. In contrast, the E-wave increases with elevated filling pressures. Thus the E/e´ ratio will increase in the presence of diastolic dysfunction. An E/e´ratio >14 is highly suggestive of elevated filling pressures. The ratio may be employed to directly estimate filling pressure by using the following formula:
LAP = (E/e´ x 1.25) + 1.9
In addition, studies have shown that the E/e´ ratio increases with the severity of heart failure, correlates well with NT pro BNP values, and declines when heart failure improves.
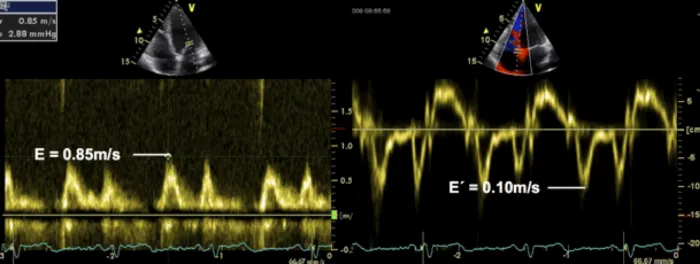
Mitral inflow Doppler signal and tissue Doppler signal of the medial mitral valve annulus in the same patient to calculate the E/e´ ratio. The ratio in this patient is 8.5 (0.85ms/0.10 ms).
From the technical point of view, the E/e´ ratio derived from the septal annulus is usually higher than that obtained from the lateral ring because e´ velocities are higher in the former. The reason is that the septal annulus cannot move as freely as the lateral annulus because it is “tethered” to the rigid intervalvular fibrosa. Velocities at the septal ring are probably also affected by the motion of the right ventricle. Thus, many investigators suggest the use of the lateral ring. Studies have shown that those measurements are more closely correlated with filling pressures. However, especially in the presence of regional wall motion abnormalities which may also reduce annular velocity, it is best to use an average of the septal and the lateral E` wave velocity. The following table shows normal values for the individual measurement sites:
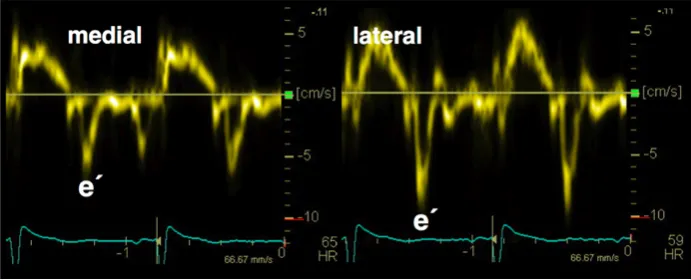
Tissue Doppler tracing of the medial and lateral annulus in the same patient. The velocity is lower in the medial aspect (0.6 cm/s) than in the lateral one (10cm/s).
| Septal E/e‘ ratio | elevated > 15 |
| Lateral E/e‘ ratio | elevated > 13 |
| Average of septal and lateral | > 14 |
The major limitation of E/e´ prime is the fact that it is not reliable in patients with left ventricular dysfunction. It can also be misleading in normal hearts. Other settings in which E/e´ should not be used are shown in the following table:
| Annular calcification | Mitral valve prosthesis |
| Mitral stenosis | Moderate to severe mitral regurgitation |
4.4.2.3 Other tissue Doppler parameters:
Both, conventional and tissue Doppler must be performed to calculate TE-e. With conventional Doppler one measures the time interval from the beginning of the QRS complex to the onset of the E-wave. With TDI one measures the time interval between the QRS complex and the e´wave. The former value is then subtracted from the latter. Thus, in essence TE-e´ describes the time interval between E an e´. The longer this interval is, the more severe is diastolic dysfunction.
As these measurements are obtained from different modalities and different beats, the investigator must ensure that the lengths of the beats match.
Normal value - IVRT/TE-e´ratio = normal <2
4.4.3 Pulmonary vein flow
A representative inflow signal from the pulmonary veins is best obtained from a four-chamber view. Use the right upper pulmonary vein and display the inflow with color-Doppler to determine where the sample volume should be placed (see Chapter 2, How to Image). The normal spectrum consists of the following components:
- A systolic component which frequently shows two peaks, namely S1 and S2. S1 corresponds to atrial relaxation while S2 occurs between atrial relaxation and the beginning of diastole (opening of the mitral valve).
- Diastolic component (D), which shows positive deflection during the early (passive) filling phase and a small negative wave (AR) during atrial contraction. AR is caused by a small fraction of blood which is pushed back into the pulmonary veins during atrial contraction.
In the presence of diastolic dysfunction and impaired left atrial filling, blood flow in the pulmonary vein will be shifted from systole to diastole. Thus, the systolic wave will become smaller and the diastolic wave larger. As reduced compliance of the ventricle results in increased resistance to flow during atrial contraction, more blood will be pumped “backwards” into the pulmonary veins as the atrium contracts. Thus, the AR wave will become larger and its duration will increase.
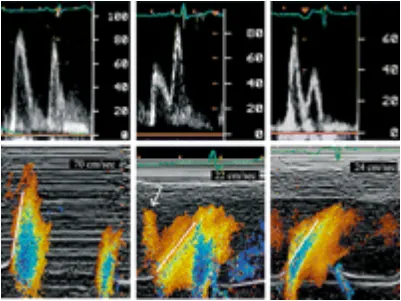
Doppler signal from the pulmonary vein and severity of diastolic dysfunction
Several parameters and calculations may be derived from the pulmonary Doppler tracing. Changes in these parameters help to quantify diastolic dysfunction:
- Peak systolic (S) velocity
- Peak anterograde diastolic (D) velocity
- S/D ratio
- Systolic filling fraction (S velocity-time integral/[S velocity-time integral / D velocity-time integral])
- Peak AR velocity in late diastole
- Duration of the AR-wave (ARdur)
- Time difference between AR velocity and mitral A-wave duration (Ar / A)
- D velocity DT.
Diastolic dysfunction is most commonly assessed by the S/D ratio, AR and ARdur and its relationship with the A-wave of mitral inflow velocity. An S/D ratio less than 40% is associated with an elevated mean left atrial pressure of 15 mmHg. When the AR velocity is more than 35 cm/s and ARdur more than 30 msec longer than the mitral inflow A-wave, left ventricular end-diastolic pressure is usually greater than 15 mmHg.
Despite the firmly established value of the pulmonary-vein approach to diastolic function, it is rarely used in clinical practice. The main reason is the difficulty in obtaining reasonable signals. It requires good imaging skills, time, and adequate image quality. Besides, when the pulmonary veins are rather small the motion of the heart will cause the sample volume to shift outside the pulmonary veins, leading to artifacts from the left atrial wall. Patients with supernormal filling will also demonstrate a larger D-wave because suction during early diastolic filling affects pulmonary flow. Finally, the A-wave may be very small and difficult to demonstrate in patients with severely elevated filling pressures.
4.4.4 Color Doppler M-mode - flow propagation
The color-Doppler M-mode is another technique to study early diastolic inflow into the left ventricle and thus diastolic function. This method is basically a means of determining how rapidly blood travels from the base of the ventricle towards the apex. In the presence of diastolic dysfunction the ventricle is stiffer and also applies less suction during early diastole. Thus, blood flow will be slower.
To display this phenomenon one uses a four-chamber color view and places the M-mode line through the mitral inflow signal. Ideally the color flow baseline is shifted below the Nyquist limit (approximately to 0.35 cm/s). The spectrum will then display a slanted flame-like color plot that is blue at its center. To measure flow propagation one measures the slope of the aliased signal (blue) from the mitral valve plane 4 cm into the ventricle. In normal individuals the slope (Vp) will be greater than 30cm/s. Blood frequently reaches the apical region before early flow at the level of the mitral valve has stopped.
In the presence of diastolic dysfunction the slope will decrease and flow might not even reach the apical regions.
By combining this information with the maximum Doppler inflow velocity of the E-wave and calculating the E/VP ratio it will be possible to estimate left ventricular filling pressures. When the ratio is above 2.5, pulmonary capillary wedge pressure (PCWP) is usually greater than 15 mmHg.
The main limitation of this technique is that the reproducibility of measurements is rather poor. It may be quite difficult to determine the exact slope because the color spectrum may be quite “fuzzy”. Besides, further progression of diastolic function does not cause the steepness of the curve to decline much further. Velocities will reduce and exact measurements may be rendered more difficult.
As the geometry of the ventricle and other flow phenomena affect the color M-mode spectrum, it is of limited use in very small ventricles, valvular heart disease (such as mitral stenosis or mitral regurgitation) and intracavitary obstructions. Finally, patients with tachycardia may demonstrate fusion of early and late diastolic filling, thus making it impossible to derive a clear early diastolic color signal.
4.4.5 Indirect signs of diastolic dysfunction
Diastolic dysfunction and elevated filling pressures are commonly observed in several conditions. In many of these, it is an inevitable consequence of the disease. Patients with (moderate to severe) left ventricular hypertrophy or systolic dysfunction always have a certain degree of diastolic dysfunction. Thus the mere presence of such findings denotes diastolic dysfunction. These abnormalities do not merely help to differentiate between normal and pseudonormal diastolic dysfunction as well as determine whether filling pressures are elevated, but also provide information about the primary cause of diastolic dysfunction.
Elevated filling pressures affect the heart. They typically cause atrial enlargement. One frequently observes bulging of the interatrial septum to the right, an expanded left atrial appendage, and dilated pulmonary veins. Further progression of diastolic dysfunction is commonly accompanied by a rise in pulmonary artery pressures and even severe tricuspid regurgitation.
Pulmonary hypertension (in the absence of pulmonary disease) indicates elevated filling pressures.
Large left atrium as an indicator of diastolic dysfunction in a patient with severe left ventricular hypertrophy.
Look for causes and accompanying signs of diastolic dysfunction.