3.3.3 Visual assessment of right ventricular function
Visual assessment of the right ventricular function is important. Usually the RV shows more inward motion relative to its size than the left ventricle. You will also note more longitudinal motion. For visual assessment it is important to look at several views in order to account for regional differences in function.
Practice estimating right ventricular function.
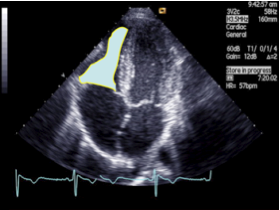
Area is assessed by tracing the endocardial boarders on the apical or subcostal 4-chamber view. Tracing the right ventricle is far more difficult than tracing the left ventricle, especially because of the numerous trabecula that make it difficult to define the cavity of the ventricle. The normal value for the RV area is < 18 to 20 cm2 and end diastole.
Right ventricular systolic function

Several methods have been proposed for quantification of right ventricular function. The most relevant techniques are presented in this section. Obviously you will not need to perform them all, but use at least use one or two, especially in patients in whom right ventricular function is very important. Also consider the fact that echo is by far less accurate than cardiac magnetic resonance imaging (CMR), which may be regarded as the gold standard.
CMR is the gold standard for quantification of right ventricular function. However, this method also has limitations.3.3.3.1 Visual assessment of right ventricular function
Visual assessment of the right ventricular function is important. Usually the RV shows more inward motion relative to its size than the left ventricle. You will also note more longitudinal motion. For visual assessment it is important to look at several views in order to account for regional differences in function.
Practice estimating right ventricular function. Video Platform Video Management Video Solutions Video Player Normal right ventricular function Video Platform Video Management Video Solutions Video Player Reduced right ventricular function3.3.3.2 Fractional area change (FAC) of the right ventricle
Direct quantification can be performed by calculating fractional area change. This is done on a 4-chamber or subcostal view by tracing the end-diastolic and end-systolic cavity, and calculating the percentage change in area.
(ED-Area-ES Area/ED-Area) x 100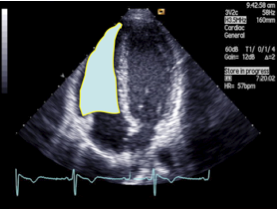
3.3.3.3 Right ventricular ejection fraction
Measurements of ejection fraction would certainly be the best way to describe right ventricular function. However, a reliable method is not available for the right ventricle because its shape is too complex and defies the use of any simple geometric model. Therefore, 2D calculations of ejection fraction are not performed. Three-dimensional echocardiography offers a solution, as it would permit calculation of true volumes. Several techniques have been introduced, some of which require minimal user interaction. Thus, 3-D echo might become the method of choice in the future.
the lower limit of normal right ventricular ejection fraction is 40-45%3.3.3.4 Right ventricular stroke volume
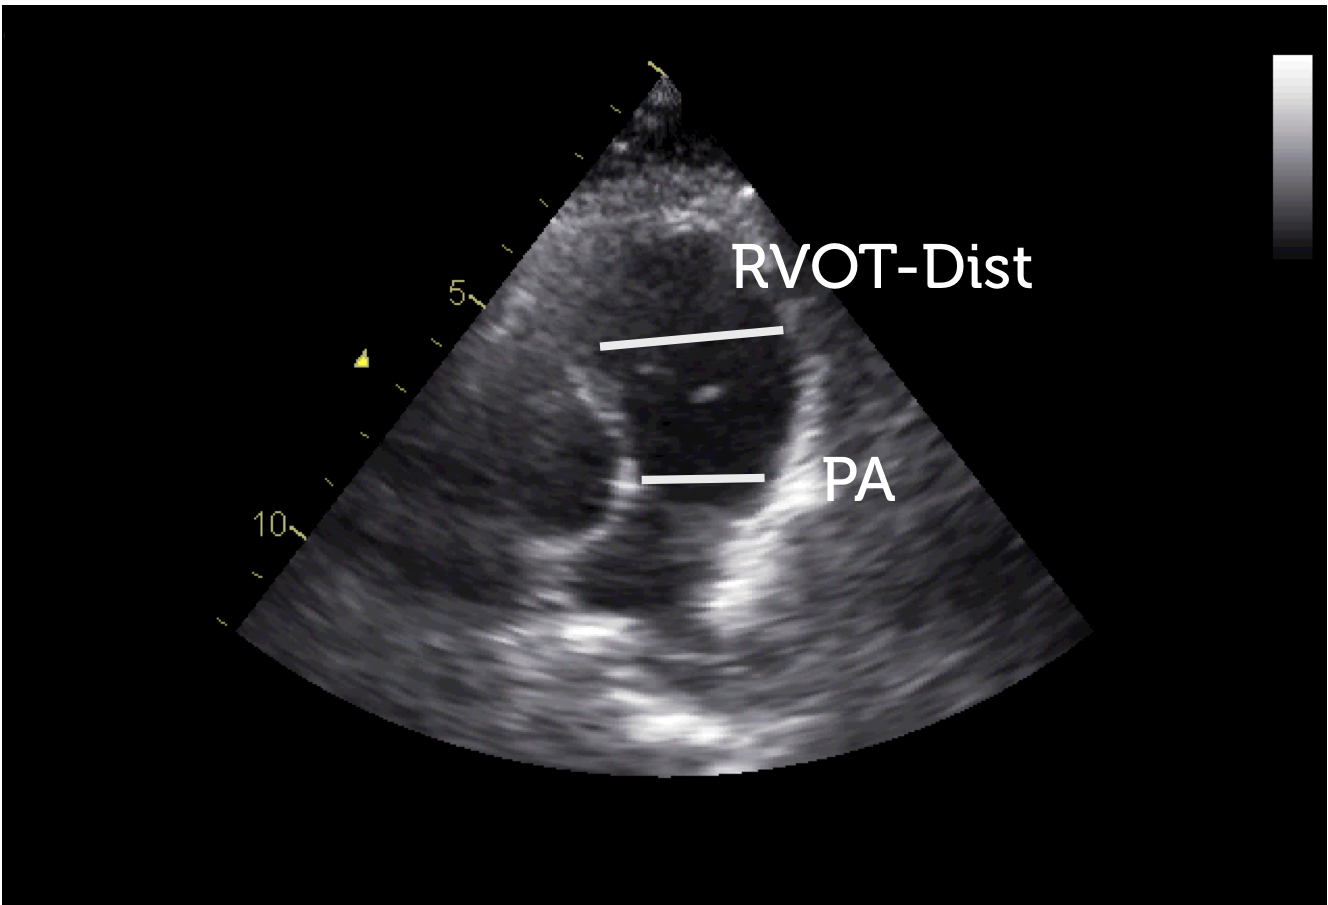
One can also look at right ventricular stroke volume. How this is done for left ventricular stroke volume has already been discussed (section 3.2.3.2 4 Hemodynamic variables). To calculate right ventricular stroke volume you simple measure the width of the pulmonary artery and the velocity time integral across the pulmonary valve / RVOT. A more simple approach is to look at the velocity time integral. A value of < 12 to 15 denotes reduced right ventricular stroke volume.
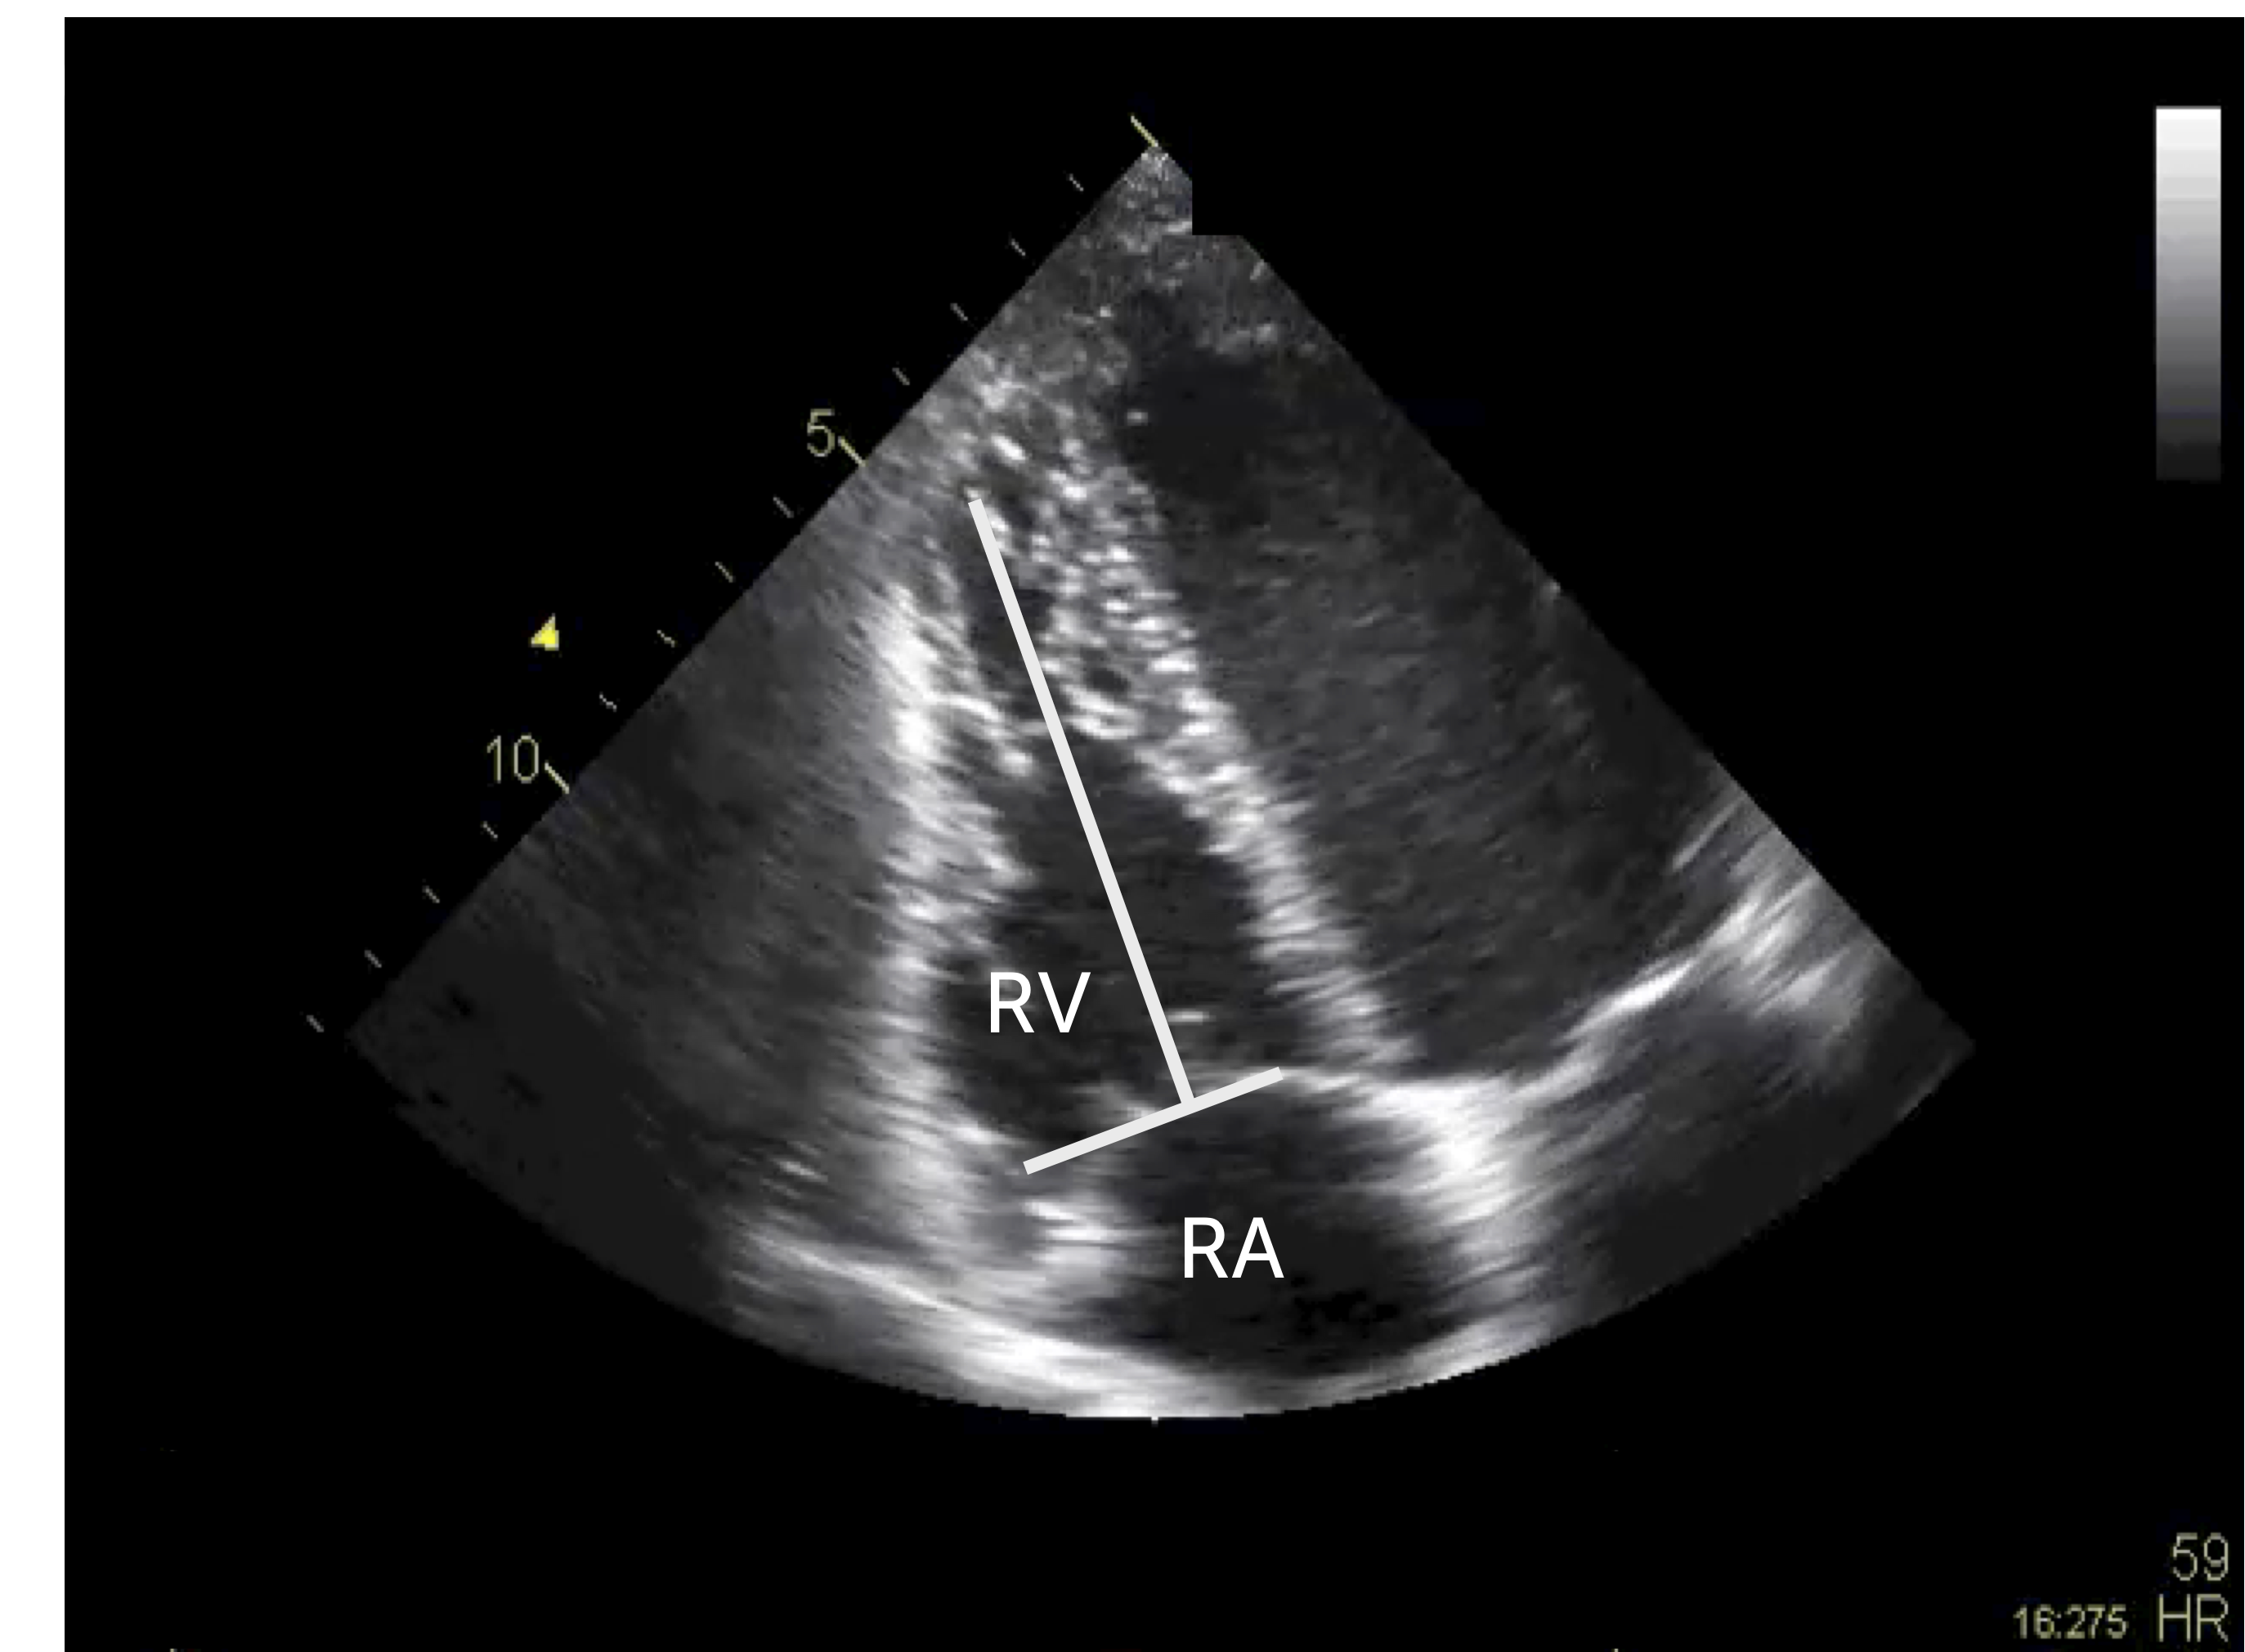
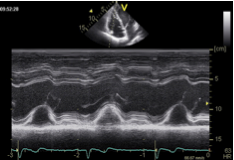
3.3.3.5 Tricuspid annulus plane systolic excursion (TAPSE)
A further way of viewing right ventricular function is by looking at the systolic excursion of the tricuspid plane annulus (TAPSE). This is done by the MMode, which is placed across the lateral tricuspid valve annulus on a 4-chamber view. Although the method is quite simple it has numerous limitations: it ignores the outlet portion of the right ventricle and the septal contribution to right ventricular function, it is strongly dependent on the angle of the MMode and is also influenced by tricuspid regurgitation. In addition, it may be difficult to interpret the MMode tracing when the right ventricle is small and other segments/structures of the right ventricle enter the field of the MMode.
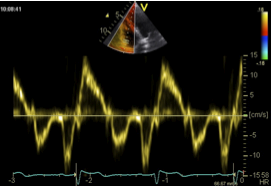
3.3.3.6 Tissue Doppler imaging for right ventricular function
Longitudinal function of the right ventricle can also be assessed with tissue Doppler. This is done by placing the sample volume at the base of the free right ventricular wall. The spectrum looks quite similar to that of the left ventricle. However, in normal individuals the systolic deflection (S) is usually somewhat higher. The maximal velocity of "S" represents longitudinal right ventricular function. The lower limit of normal is 10 cm/sec.
3.3.3.7 Right ventricular strain
Speckle tracking echocardiography can also be used for the right ventricle. Measurement of global and regional peak longitudinal systolic strain probably best reflects RV function. These are obtained from an apical four-chamber view. The strain of the free lateral wall represents RV function (the septum to a greater degree reflects left ventricular function). There is increasing evidence that right ventricular strain is able to detect right ventricular dysfunction even in an early stage. However, many issues are still open, including the question of how loading conditions alter right ventricular strain. Moreover, it will be necessary to develop tracing algorithms designed specifically for the right ventricle, and to define normal values
Speckle tracking-derived strain values (longitudinal function) in a normal individual
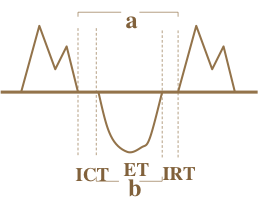
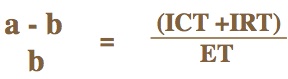
When using tissue Doppler to determine right ventricular function, the wall of the right ventricle should be as parallel as possible to the Doppler orientation.3.3.3.8 Myocardial performance index (Tei) for right ventricular function
The myocardial performance index (Tei index) is calculated either from the Doppler inflow signal of the tricuspid valve or the TDI spectrum and the tricuspid valve annulus. It is calculated as the isovolumetric contraction time + isovolumetric relaxation time divided by the ejection time. This might sound complex, but is quite easy to calculate in clinical practice. All you need to do is measure the distance between two consecutive PW tricuspid inflow curves (a) and divide this value by the duration of pulmonary outflow (b). If you use tissue Doppler the ejection time is measured by the duration of "S" (see the formula below). The Tei index reflects both systolic AND diastolic function. Thus, it is a global parameter of myocardial function. The normal range is 0.32 to 0.24; values above 0.32 denote reduced right ventricular function.