
16.2.2.1 Pulmonary acceleration time to estimate pulmonary pressure
There may be situations in which no tricuspid regurgitation is present or the signal is inadequate to obtain reliable measurements. In these cases it is particularly valuable to look at the PW Doppler signal of pulmonary flow. This is best done at the level of the pulmonary valve (see Chapter 2, How to Image).
Do not look for the PW Doppler signal of systolic flow in the right ventricular outflow tract. The orientation of the Doppler beam is rarely parallel to flow at this location.
The normal spectrum is more or less symmetrical in shape. Its maximum velocity is in the range of 0.8 -1.2 m/sec. When pulmonary pressure and pulmonary vascular resistance are high the peak will occur earlier. This can be quantified using the pulmonary velocity acceleration time (PVAT). It is the interval between the onset of flow and peak flow.
The normal PVAT is > 130 msec.
Use the sharp echo caused by the pulmonary valve opening to define the beginning of systolic flow.
In severe forms of pulmonary hypertension you will find a mid-systolic notch in the descending portion of the signal. The notch is probably caused by a pathologic wave reflection in the presence of elevated pulmonary artery impedance. Interestingly, the peak of the mid-systolic notch is later in peripheral pulmonary obstruction (i.e. pulmonary arterial hypertension) than in proximal obstruction (i.e. caused by pulmonary emboli).
Using pulmonary acceleration time and the systolic notch one can estimate the severity of pulmonary hypertension on the basis of the following scale:
| Severity | PVAT |
|---|---|
| normal PAP | > 130 msec |
| borderline PAP | 100 - 130 msec |
| mildly elevated PAP | 80 - 100 msec |
| severely elevated PAP | < 80 msec / systolic notch |
While the PW Doppler signal can be obtained in almost all patients, it is not always easy to measure the PVAT. It may be difficult to define the peak of the curve. Heart rate also influences the PVAT. It is advisable to measure the PVAT only when the heart rate is between 60 and 100 /min. PVAT may also underestimate the severity of pulmonary hypertension when right ventricular flow is increased, as in the presence of atrial septal defects or severe pulmonary regurgitation.
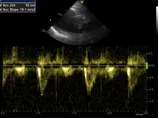
Pulsed-wave Doppler tracing across the pulmonary valve in a patient with severe pulmonary hypertension. The spectrum shows an early peak and the PVAT is significantly shortened (62 msec).
Expect low velocities across the pulmonary valve in severe pulmonary hypertension, as it reflects a low cardiac output.
16.2.2.2 Mean pulmonary pressure, diastolic pulmonary pressure and pulmonary vascular resistance
Echocardiography permits calculation of mean and even diastolic pulmonary artery pressure. Although these calculations are rarely performed, they may help the investigator to confirm the diagnosis or cause him/her to suspect the diagnosis in ambiguous situations (especially when no TR signal is present). Pulmonary artery diastolic pressure can be estimated by looking at the pulmonary regurgitation signal (parasternal short-axis view). The velocity at end-diastole (at the QRS complex on the ECG) is converted into a pressure gradient (modified Bernoulli equation). The estimate of right atrial pressure is added to this value.
sPAP= PRvel2 x 4 + RAP
Another means of estimating mean pulmonary artery pressure is by using the maximal PR velocity and applying the following formula.
MPAP = 4x peak PR velocity
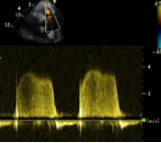
Pulmonary regurgitation, CW Doppler spectrum. Diastolic pulmonary pressure can be measured from end-diastolic velocity.
It is also possible to measure mean pulmonary pressure from the pulmonary "forward" flow signal using Mahan's regression equation:
MPAP =79 - 0.45 (AcT)
Several studies have shown that pulmonary vascular resistance can be calculated with echocardiography. This is done by measuring maximal tricuspid velocity (TR vel) and the velocity-time integral across the pulmonary valve (TVI PV) and using the following formula:
Catheter = (MPAP - PCWP)/CO
Echo = 10x(TRvel/PV TVI) + 0.16
Others have suggested using the velocity-time interval across the left ventricular outflow tract instead:
TR vel / TVI LVOT
Although estimation of pulmonary vascular resistance would be of great help to differentiate between pre-and post-capillary pulmonary hypertension without the need for heart catheterization, none of these calculations are exact. Specifically, they lack sensitivity for the detection of elevated pulmonary vascular resistance.