
3.2.2 Size of the left ventricle
Measurement of the size of the ventricle should be a part of every echo report, because it provides diagnostic clues and prognostic information, and enables the clinician to follow patients in respect of disease progression (or improvement). Quantification of the size of the ventricle is not always as easy as it may seem. The endocardial margins must be visible, the views should be optimal, and foreshortening of the ventricle should be avoided (see Chapter 2 - How to Image). Various measurements can be performed to determine size: the diameter of the ventricle, its length, its area, or its volume. I would advise performing several measurements at distinct time points of the cardiac cycle: the end of diastole and the end of systole.
The end of diastole is seen when the ventricle is largest, shortly before the mitral valve closes and the mitral annulus descends.
The end of systole is the time when the ventricle is smallest - shortly before the mitral valve opens.
3.2.2.1 Measurement of diameter
The advantage of measuring diameter is that it can be done rather quickly. The measurements are reproducible and provide a good estimate of the size of the ventricle. Management guidelines are frequently based on such measurements. Although poor image quality and oblique views may render it difficult to perform measurements, the latter should be part of every exam. Measurements of the left ventricle can be obtained by the MMode or by 2D methods.
3.2.2.1.1 MMode measurements / Diameter
MMode still is the most widely used the technique. The reasons are historical. MMode was the first technique of echocardiography. Millions of publications describe the use of the MMode to determine the size of the left ventricle. One reason is the fact that the MMode has a high time resolution, which is an important aspect of this method (see Chapter 1, Principles of Echocardiography). The disadvantage of the MMode is that we can only measure the left ventricle in those orientations the mode permits, which is along the MMode line. This is a major limitation because the conventional MMode line is fixed at the top of the image. You could circumvent the problem by using the "anatomical MMode" (see Chapter 1 Technical Principles). However, not all scanners provide this function and the anatomical MMode also has its limitations (poor temporal and spatial resolution).
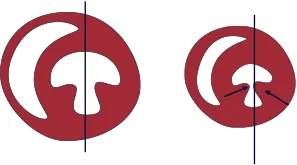
To derive MMode diameters, use a parasternal long-axis view and place the mode line such that it cuts through the right ventricle (the interventricular septum), the cavity of the left ventricle, and the posterolateral wall. The exact position of the MMode should be adjusted so that you cut through the ventricle between the papillary muscle and the mitral valve.
Care must be taken to ensure that you are perpendicular to the structures of the left ventricle, failing which your measurements will overestimate the size of the left ventricle. This perpendicular position is not always easy to obtain; it depends on the position of the transducer. Your MMode tracing will be oblique if you image from an intercostal space that is too low. One way of checking the accuracy of your parasternal view is to look at the relationship between the aorta and the interventricular septum. If there is an "angle" between the two, you are usually too low with the transducer. In a considerable number of patients you will be simply unable to record such a view. If this is the case, don't perform MMode measurements.

MMode position: The red line depicts correct orientation; the black line shows oblique orientation of the MMode
MMode Measurements of the left ventricle can only be obtained in about 75% of patients
Delineation of the endocardial margins on the MMode tracing is not always easy. As the MMode line lies between the papillary muscle and the mitral valve we will also traverse chordae, which may be mistaken for the posterolateral wall. As a rule of thumb, the motion of these chordae during systole is not as steep as that of the posterolateral wall.
In small ventricles you will have the problem of inward motion (wall and portions of the papillary muscle) from the sides, which enters the field of view of the MMode. This may cause the investigator to underestimate end-systolic diameter.
Pitfall of the MMode: In small ventricles with prominent papillary muscles, these muscles may lead to "pseudoshortening" of end-systolic diameter and consequent overestimation of left ventricular function.
To facilitate interpretation I would suggest you always look at the reference 2D image. It will clearly show the structures that pass through the MMode.
If you have difficulties in interpreting the MMode tracing, look at the 2D reference image.
Usually you will not only measure the diameter of the ventricles but also the thickness of the septum and the posterolateral wall. In addition, you may calculate its fractional shortening. Fractional shortening will be discussed in the section on left ventricular function. To measure end-diastolic diameter use the section of the MMode in which the ventricle is largest, shortly before the walls begin to move inward (onset of the QRS complex). For the end-systolic dimension, pick the region in which the ventricular cavity is smallest. This usually is at the tip of the T-wave.
In the presence of dyssychrony it becomes difficult to define end diastole and end systole. Use the largest and smallest dimensions you find.
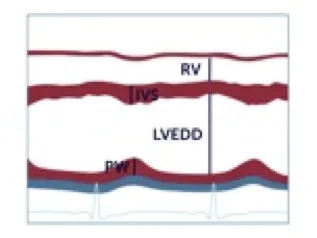
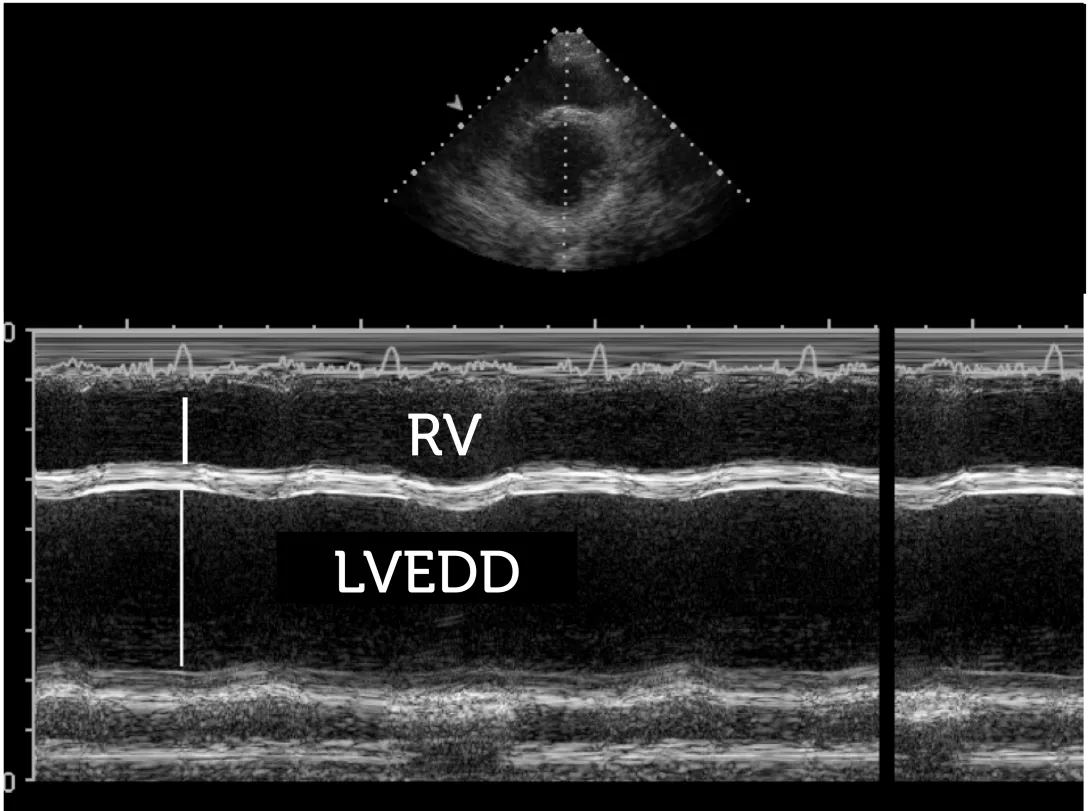
MMode of the left ventricle. The end-diastolic dimension is measured at the onset of the QRS complex, where the left ventricle is largest
The following table shows the normal dimensions of the ventricle as measured by the MMode.
Image

| Image

| |
| Normal (mm) | 42—59 | 39—53 |
| Mild (mm) | 60—63 | 54—57 |
| Moderate (mm) | 64—68 | 58—61 |
| Severe (mm) | ≥ 69 | ≥ 62 |
LVED diameter — Reference values
Ideally, these measurements should be indexed to the body surface area (BSA)
Image
| Image
| |
| Normal (cm/m2) | 2,2—3,1 | 2,4—3,2 |
| Mild (cm/m2) | 3,2—3,4 | 3,3—3,4 |
| Moderate (cm/m2) | 3,5—3,6 | 3,5—3,7 |
| Severe (cm/m2) | ≥ 3,7 | ≥ 3,8 |
LVED diameter/BSA — Reference values
3.2.2.1.2 Two-dimensional measurement of the left ventricle / Diameter
You can measure the dimensions of the left ventricle in several views. The best and most widely used one is the four-chamber view. Although the 2D mode and the MMode do not measure exactly the same diameter, the measurements are quite concurrent.
Use a four-chamber view in which you are able to clearly see the endocardial margin of the lateral wall and the septum, and measure between these margins - at a level that lies between the papillary muscle and the mitral valve.
Make sure you measure from the endocardial surface and not from the myocardium or pericardium, which usually has a brighter echo.
You may also use a parasternal view (short and long axis) or a subcostal view, but do not use a 2-chamber view, because the dimensions of the left ventricle appear smaller on it.

2D measurement of left ventricular diameter on a parasternal long-axis view

2D measurements of left ventricular diameter on the four-chamber view.
Many views may be used to measure the dimensions of left ventricle.
The apical views also provide an opportunity to measure the length of the left ventricle. Although this parameter is clinically less useful, you will need its length to calculate volume (see section: Volume of the left ventricle) and left ventricular mass.
3.2.2.2 Volume measurements of the left ventricle
Volume measurements should be given preference over diameter. Diameter does not account for the geometry of the entire heart. Let's take the instance of a patient with an apical aneurysm. Two-dimensional or MMode measurements at the base of the ventricle will underestimate the true size of the heart. In addition, even a small increment in diameter is a large increase in volume. This is simple geometry. Many scanners use a formula to derive volume calculations from MMode measurements. While this gives you a rough idea of left ventricular volume, it should not be used for the above mentioned reasons.
Formula to derive left ventricular volume using the MMode
Two-dimensional measurements do not describe the geometry of the ventricle and are insensitive to differences in volume. Use volumetric parameters whenever possible.
It is better to use other methods. Volume may be calculated in three ways:
- The area length method
- The Simpson method
- Three-dimensional volume calculation
3.2.2.2.1 Area length method
The area length method is very simple: volume is calculated on the basis of the area of the left ventricle on a four-camber view, and the length of the ventricle measured from the mitral annular plane to the apex. All you need to do is trace the endocardium and measure the length of the ventricle (which is usually done automatically). These values are entered in the formula:

Area length formula
You need not memorize the formula. First, most scanners can compute the volume once you have performed the measurements; second, this method is rarely used today. This is for a simple reason: the calculation relies on a rather crude geometric assumption. Besides, the Simpson method is a much better way to approximate volumes.
3.2.2.2.2 The Simpson method
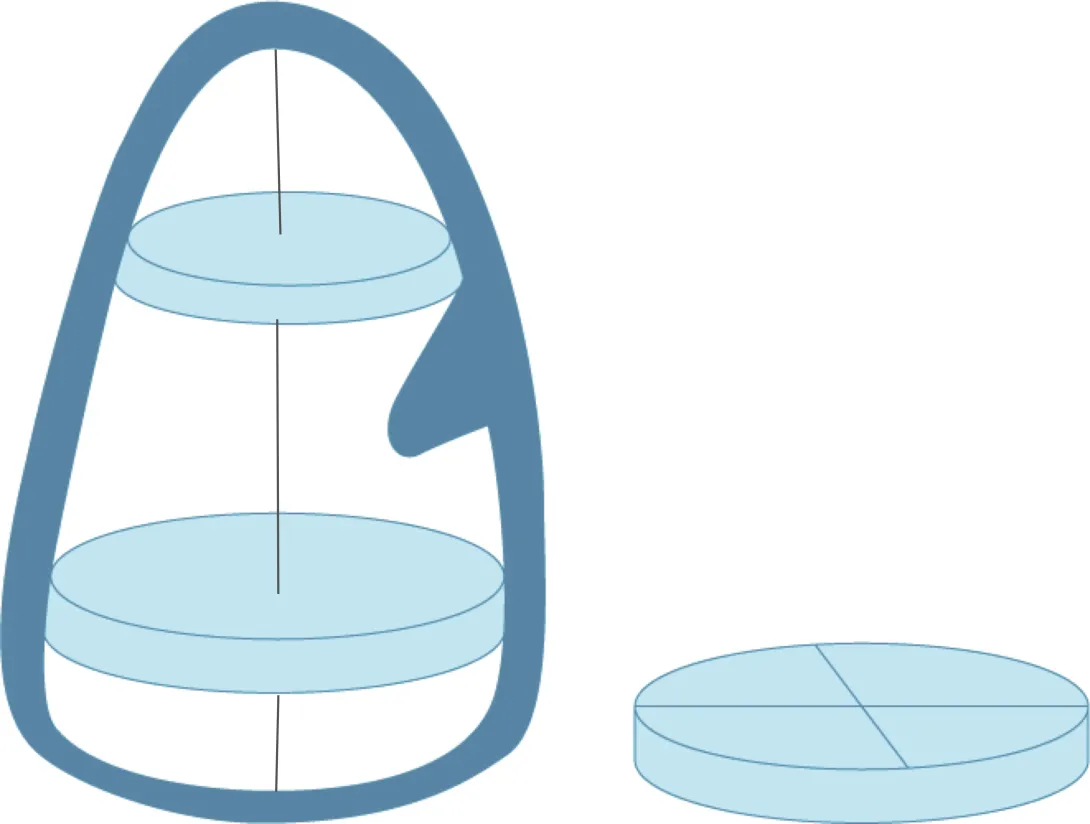
The Simpson method is also known as the method of discs because it integrates volume by fitting numerous discs into the ventricle and sums up their volume. The volume of each disc is determined by the diameter of the disc and its height.
Simpson Volume = (A1 + A2 +...+An) x h
The measurement is performed the same way as the area length method. You simply trace the contour of the endocardium on a four-chamber view. Based on your tracing, the system automatically performs a short-axis segmentation from the base to the apex. On the screen you will see numerous short-axis lines. Each of these represents the diameter of a disc. The distance between the lines is the height of the disc. Based on your tracing, the length of the ventricle is automatically calculated by the scanner.
The Simpson method also makes geometric assumptions. It considers the discs to be circular (defined by the diameter). Actually the cross-section of the ventricle is not round, especially in the presence of pathologies. To obtain a better approximation, you may use the Simpson method on a two-chamber view as well. By using this second view you will now have two diameters lying perpendicular to each other. This permits the discs to be oval-shaped, which better fits the geometry of the ventricle. This approach is also known as the Biplane Simpson Method. The latter is the most commonly used method to quantify left ventricular volumes and ejection fraction. You should use it as often as possible. However, you should be aware of its numerous limitations and the fact that it is actually not as accurate as many consider it to be. Compared to MRI the calculated volumes may be significantly smaller. Why is this so and what are the difficulties?
Foreshortening: Remember that we usually do not see the very apical part of the ventricle. This means we tend to underestimate the true volume of the ventricle. As foreshortening does not occur on MRI, the measurements obtained with MRI are generally greater.
Video Platform Video Management Video Solutions Video Player
Foreshortened left ventricle: note that the ventricle appears short and that the apex has a „round shape“.
Mistakes associated with tracing the endocardial margins. It may be difficult to see the endocardial surface, especially in case of poor image quality. Besides, the inner surface of the heart is by no means smooth. It is full of trabeculae, especially at the apex.
Tracing the endocardium - Tips:
- Use the best images you can get.
- Avoid foreshortening.
- Scroll back and forth between frames; it is easier to detect margins on a moving image.
- Use an ECG tracing to define end-systolic and end-diastolic frames.
- Exclude the papillary muscles when you trace.
- Use left ventricular contrast agents in case of poor image quality
The biplane Simpson method is still based on geometric assumptions: Geometric deviations, which are not seen on the four- or two-chamber view, are ignored when using this method. For example, if you have an aneurysm in the posterolateral wall you will simply not account for the increased volume when using the Simpson method. This limitation is important when using Simpson-derived volumes to compute ejection fraction (see section Ejection Fraction).
Given these limitations, use the method only in those patients in whom you can trust the measurements.
3.2.2.2.3 Three-dimensional volume calculation
The advent of 3D echo has made it possible to compute volumes of the ventricle without having to apply geometric assumptions. Numerous approaches have been introduced. In general it requires the acquisition of a full volume set and delineation of endocardial margins. This is usually done by the use of a semiautomatic algorithm. The user either defines certain anatomic landmarks (such as the apex, the mitral annulus, LVOT etc), or roughly traces the endocardial margin on reference views. As three-dimensional echocardiography utilizes many (reconstructed) views to calculate volumes, it is practically free of geometric assumption. However, only high-end scanners provide 3D capabilities. You will read more about 3D echo in the section on left ventricular function.
Three-dimensional echocardiography can be combined with contrast echocardiography. This approach enhances identification of endocardial margins.
Image
| Image
| |
| Normal (mL) | 67—155 | 56—104 |
| Mild (mL) | 156—178 | 105—117 |
| Moderate (mL) | 179—200 | 118—130 |
| Severe (mL) | ≥ 201 | ≥ 131 |
LV Diastolic Volume (four chamber view) — Reference Values
Image
| Image
| |
| Normal (mL) | 22—58 | 19—49 |
| Mild (mL) | 59—70 | 50—59 |
| Moderate (mL) | 71—82 | 60—69 |
| Severe (mL) | ≥ 83 | ≥ 70 |
LV Systolic Volume (four chamber view) — Reference Values